I’m interested how y’all check/monitor your reverse proxy logs. I run an nginx vm that has ports 80 and 443 forwarded that exposes some of my services to the internet on different domains. I use nginx exporter for Prometheus, but I would like a better monitoring to see what connects to my services (like my Lemmy instance).
If I would be under pressure by LLM scrapers for example, I would only notice via application and hardware metrics, but I would have to figure out what’s going on.
Sounds like what you want is tracing. OpenTelemetry is the de facto standard for that. Couple it with aggressive sampling (here’s a great talk on it https://www.usenix.org/conference/srecon24americas/presentation/cruz ) and you’ll have a very efficient way of identifying use patterns.
Your proxy doesn’t have its own logs?
I use Apache for reverse proxying and it’s just standard access logs.
I built a python script to monitor all my access logs:
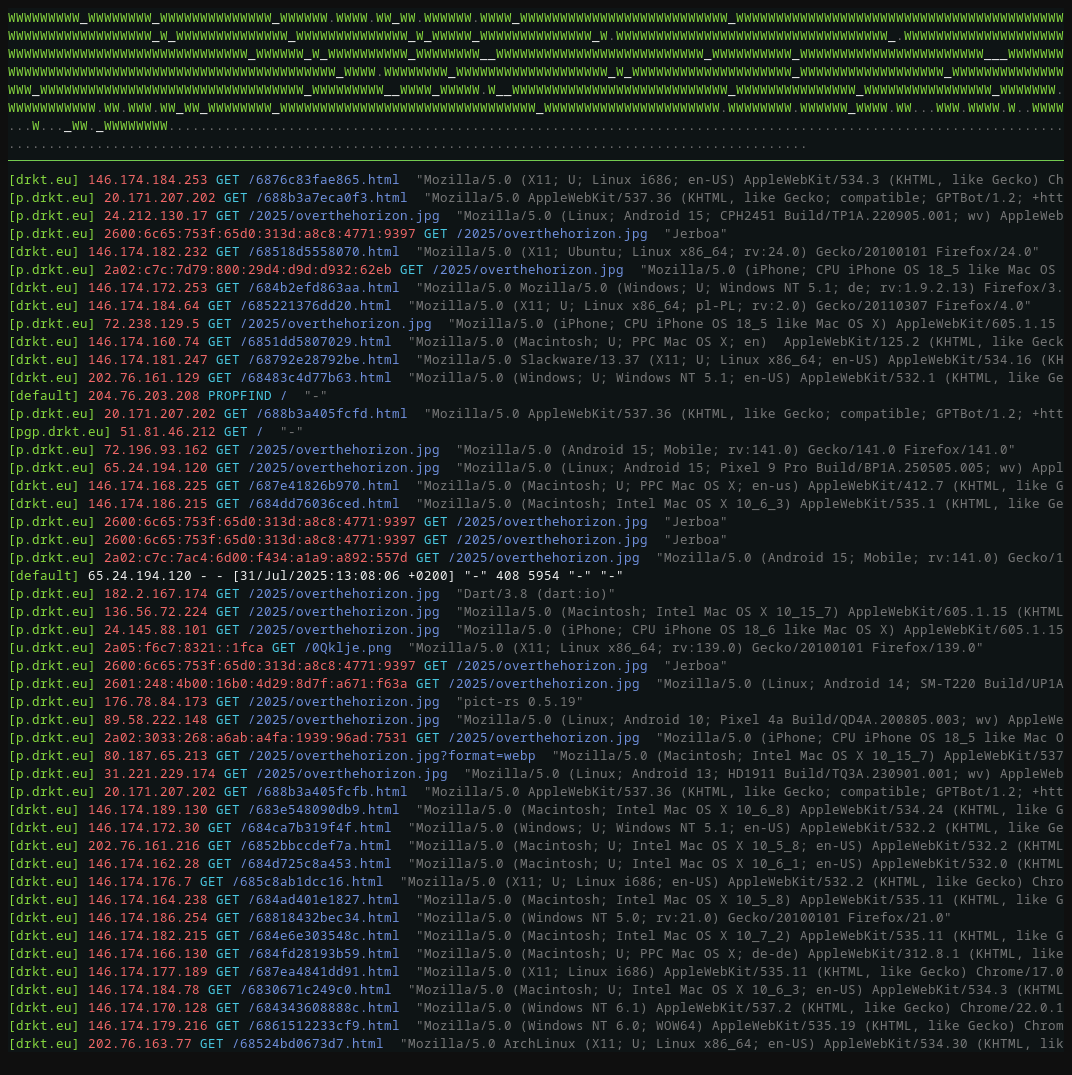
It has logs of course, but I want something like a dashboard and alerts, not having to scroll a textfile
I use Promtail + Loki + Grafana to monitor application logs. Promtail scrapes logs, Loki stores and indexes them and Grafana can query Loki with LogQL and also send alerts.
Apparently Promtail is superseded by Grafana Alloy, which I don’t have experience with.
Anyway, I set this up mostly for fun and to preserve logs of terminated pods in my kubernetes cluster. I don’t have any alerts in place, but I probably could.
Depending on what your log files look like, look at ‘GoAccess’.
I think you’re gonna be disappointed with existing solutions if you don’t want to sit and stare at text files. It’s big business to automate this kind of stuff, because it’s hard.I gave it a quick try and while it’s not exactly what I had in mind, it’s pretty cool! I’ll organize my log formats a bit and check it out more in depth, thanks
Try out GoAcess.